

Confirmed: Carbon Emissions Cause Stock Prices to Drop
Unrefutable causal evidence that a major steel producer’s emissions depress its market valuation


My cofounders and I have been moving away from sustainability. We’re not abandoning it (I wouldn’t let them), but we want to embrace a bigger idea: We’re modeling entire companies, and financial and sustainability datapoints are just part of the bigger whole that companies are. (And we’re looking to model plenty of other things too—geographies, nation states, industry sectors… and down to company departments, customer segments, supply chain pressures, and so on.)
But I can’t stop my addiction to sustainability. Partly because I’ve been working in the field for a while, and so so many projects, contacts, and datasets come from there. And partly because I believe deep down that I can’t contribute to life in a better world without looking at sustainability.
Sustainability is the backbone of Wangari, but we’re fleshing out our offer and skills with plenty more—systems thinking, agentic AI, causal modeling, and chatbot interfaces. It’s all still under construction. But when any of these technological advances somehow bring sustainability to the next level, I feel irrational amounts of joy.
This is the case with this piece. Spoiler alert: There’s a non-null result further down.
Last week, we investigated whether excessive groundwater extraction caused profit declines. The causal effect was huge—but then got refuted. Fed with randomized data, our causal model just didn’t hold up.
This week is different. I decided to test a different hypothesis in the hopes of finding something more “marketable,” as they’d say.
I got lucky. Here’s how I used causal inference to find out that excessive carbon emissions cause the stock price of the world’s second-largest steel producer ArcelorMittal to tank.
This Is Big News
From academia to asset management, research on “carbon pricing in markets” has exploded. Banks run carbon-risk stress tests. Academic papers show green portfolios outperform brown ones.
But almost none of these studies prove causality.
Maybe higher carbon emissions are just a side effect of producing more steel (and higher profits).
Maybe carbon-heavy years coincide with economic booms or commodity cycles.
Maybe volatility in the stock market amplifies perceived carbon risk without emissions themselves being causal.
Without causal inference, we’re stuck speculating. It’s good if investors hedge carbon risk and if regulators design carbon taxes. But this is all like running a marathon in the dark as long as we don’t know if emissions directly change market value.
Imagine if we were able to prove that it’s cause-and-effect: Now we don’t really need carbon taxes or carbon risk hedging so badly. Big-corp CEOs will do everything in their power to get emissions down if they know that this behavior causes the share price to stay up.
Our Causal Model
We used the same dataset I already mentioned in last week’s post. It has more than 140 different variables and 12 years of data, so there’s clearly no shortage of possible hypotheses one can formulate.
Carbon emissions being the classic, I decided to go with that. I’d previously stayed away from these datapoints because the correlations were so weak. For the steel-related carbon emissions at ArcelorMittal, I calculated a weak (but statistically significant correlation of -0.076 with the stock price.
Correlation is not causation, so that’s not the end of this story. It doesn’t tell you what causes what. For all we know, low stock prices could even cause higher emissions—seems unlikely but it could happen. Or a third variable causes variations in both.
Correlation will not give you information about this. Causal inference is needed.
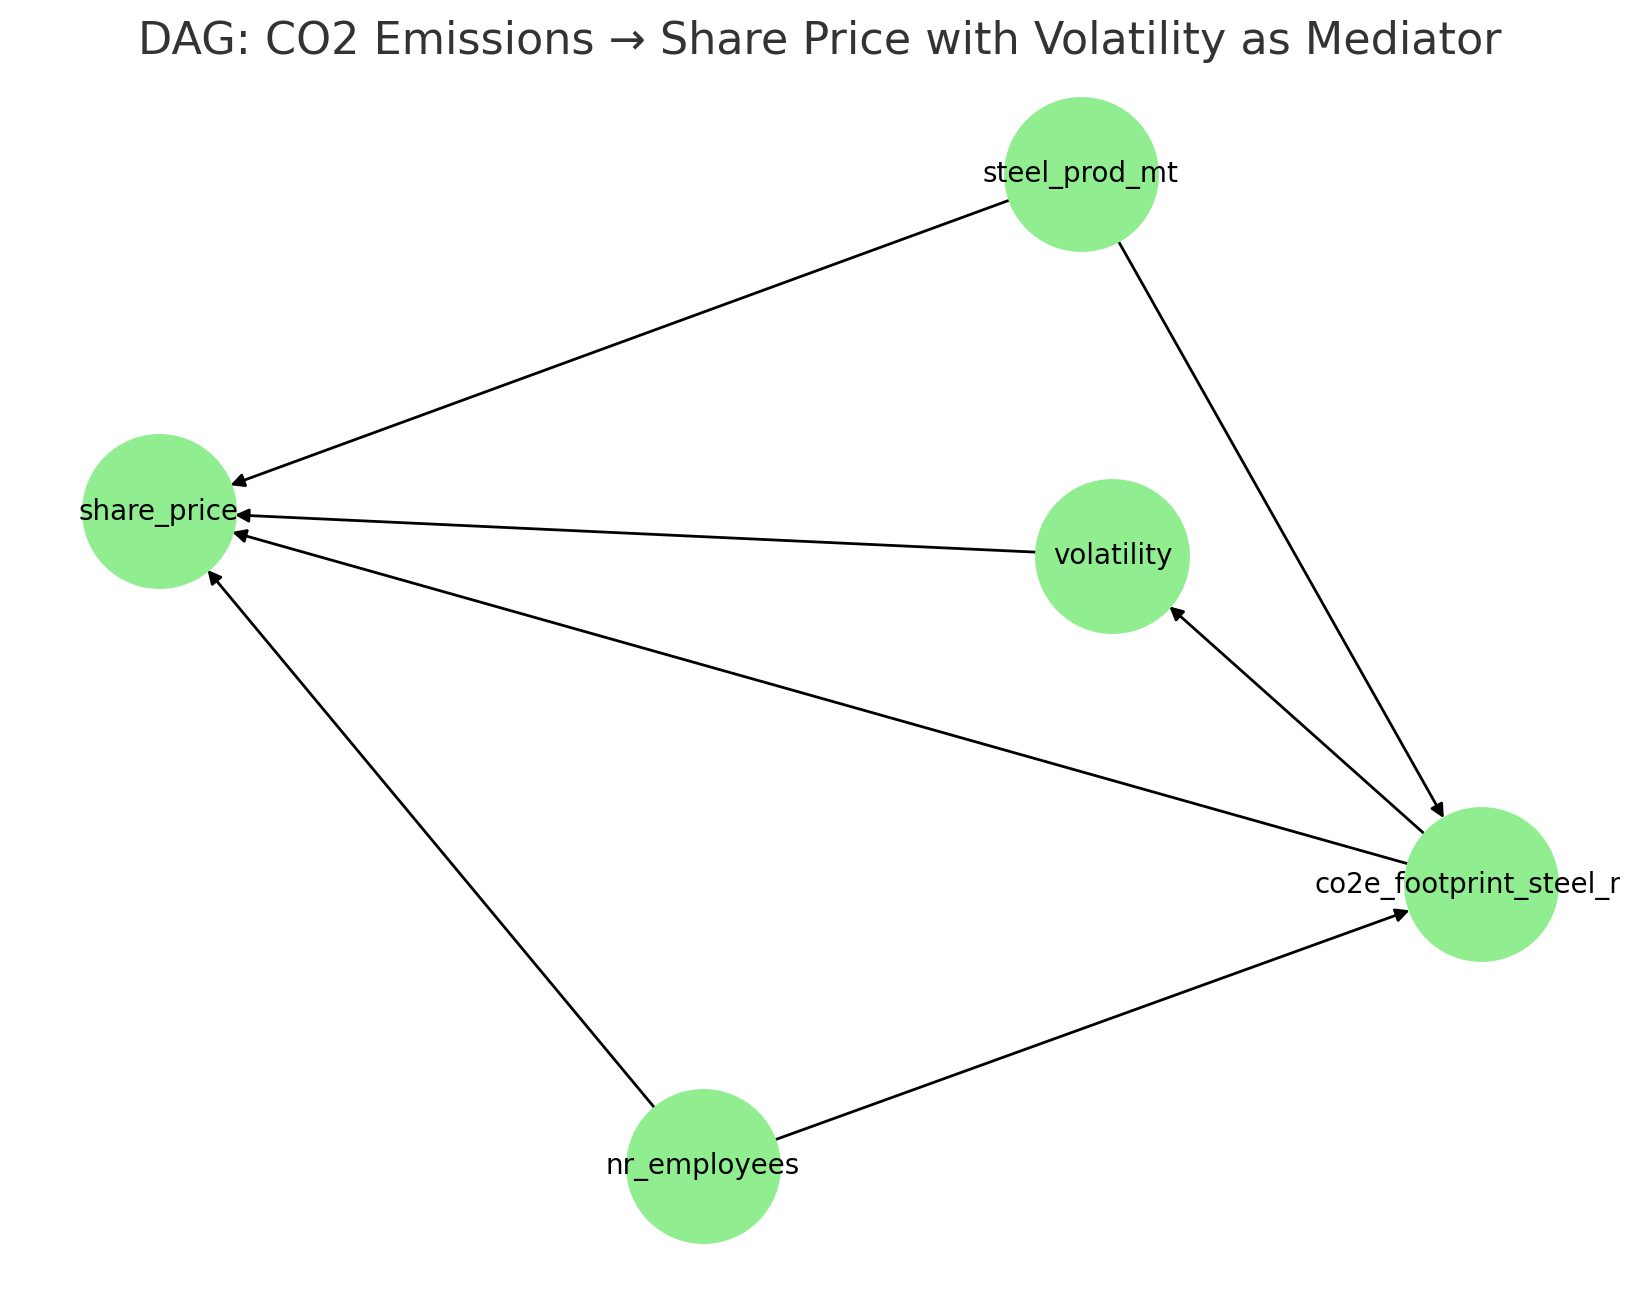
For this analysis, we used:
Treatment: Annual CO₂-equivalent footprint from steel production (
co2e_footprint_steel_mt). Treatment means that tuning this variable causes the outcome to change.Outcome: Yearly average
share_price, calculated as the mean of annual high and low. It’s worth mentioning that this is a rather crude estimation, and if I made a research paper from this analysis I’d likely use a more sophisticated method like calculating the yearly mean (or median) of all daily closes. (For a paper, I’d likely also add many many more steel producers to see if the causal effect holds up across the entire sector.)Mediator: Market volatility. This is approximated as half the high-low spread. Again, I’d calculate the standard deviation of daily closes if I were to write an academic paper about this or do a paid study for a client.
Confounders: Steel production volume (
steel_prod_mt) and workforce size (nr_employees). These variables likely affect both carbon emissions and stock price, so we’ll need to control for their effects.
In fact, volatility is particularly interesting—it’s how nervous the market gets. If emissions make investors jittery, we’d expect volatility to spike, pushing the stock down even further. See the graph below.
Running the Model
Like last week, we set up this model with Python’s DoWhy library. It automates many of the otherwise fastidious mathematical operations that go into proving causality. To be extra sure of our results, we use two different refutation methods. (Refuting means trying to destroy your causal model with randomized data and checking whether your results hold up.)
This is the code to instantiate the refutations:
# Refutations
refute_bootstrap_total = model_total.refute_estimate(
    estimand_total, estimate_total, method_name="bootstrap_refuter"
)
print(refute_bootstrap_total)

refute_random_total = model_total.refute_estimate(
    estimand_total, estimate_total, method_name="random_common_cause"
)
print(refute_random_total)
The results made my heart jump. Yay, here’s a big-money argument for saving the planet!
Not that I’m not transparent about the things I don’t find—see last Friday’s post—nor that I won’t be transparent about big-money arguments for harming the planet, because in the interest of scientific integrity I’ll even report about those when I find them. But hey, it feels good to find an incentive to do something we all know is the right move.
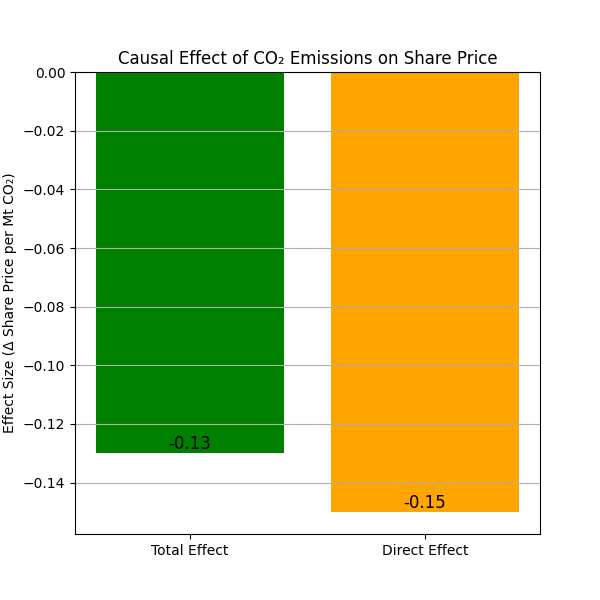
The results are the following:
Total effect: ~-0.13 cents per megaton. This means that for every megaton of CO2 that ArcelorMittal slashes from their emissions budget, they gain 13 cents in share price. This effect is bigger than it sounds: At a share price of ~25 Euros and emissions around 100 megatonnes per year, this means that decreasing emissions by one percent causes the share price to go up by half a percent. (I’ve read about big-corp CEOs doing crazier things to get their share price up a fraction of a percent.)
Direct effect: ~-0.15 cents per megaton. Even when we control for volatility, the negative causal effect persists. In fact, it even gets a tiny bit stronger still! But we’ll stay conservative and run with the smaller estimate for now.
Robustness: Neither bootstrap resampling nor random common cause refuters could shake this result (p ≈ 0.8–1.0). This is huge news. Last week, refutation destroyed our pretty result. This week, we used two different refutation methods and couldn’t kill it.
Correlations Couldn’t Tell You This
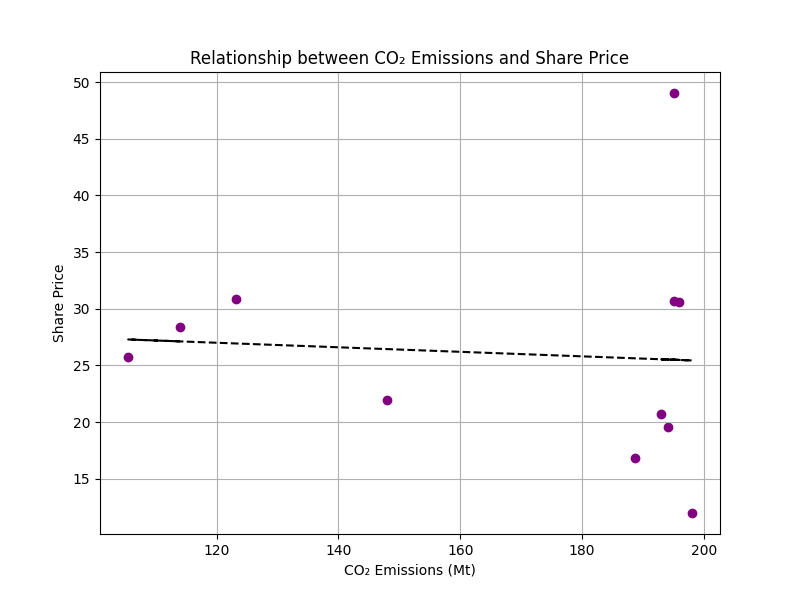
One reason why I got so irrationally (unrefutably?) happy with this result is that I wasn’t expecting it at all. I gave it a try because it’s a classic relationship—but the correlation I’d found between share price and carbon emissions was a mere -0.076, which is super small.
Correlation basically tells you something about the scatter of two datapoints against one another. The closer to zero, the more scattered they are. The closer to 1 or -1, the more perfect their linear relationship.
You can see that share price and carbon emissions indeed scatter hugely against one another:
Despite the scatter, one can see that the share price indeed moves in the opposite direction of carbon emissions in most years. This is evident if you plot both up against the time axis:
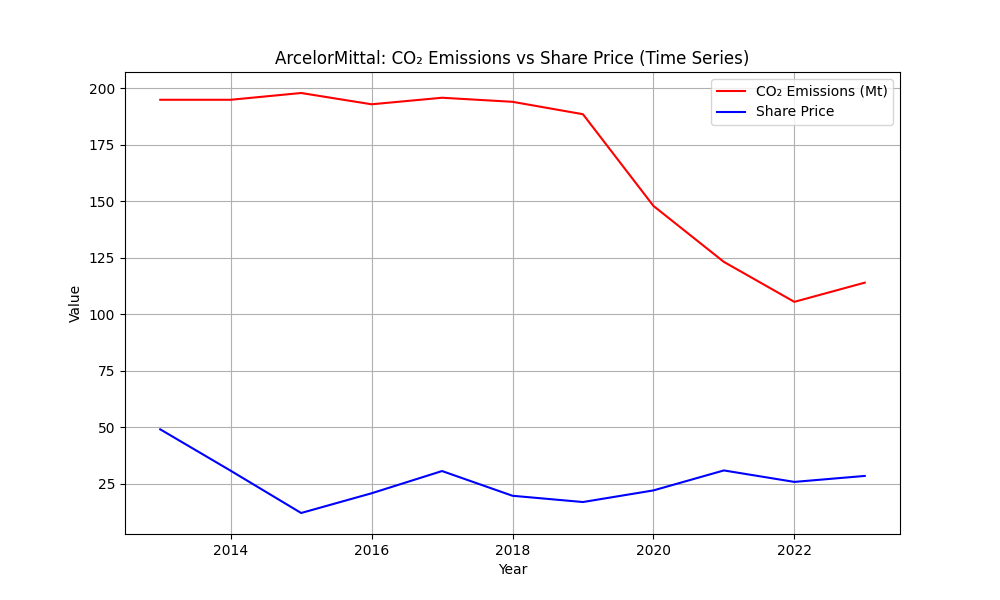
That being said, one can also see so much noise (and how did those emissions get slashed in half between 2019 and 2022?) on this graph. From looking at this alone one can’t see any causality.
If anything, just looking at correlation throws up more questions than answers. One can use correlations to refine financial models—in fact, this was the founding premise of Wangari.
But I’m glad we moved away from this. Causal inference actually gives us solid answers. And, small bonus, one can even use these treatment effects to refine financial models, only even better than one could have done with correlations alone.
This Makes Me Happy
This is the kind of evidence that changes behavior:
For investors: You don’t need to wait for regulators. Emissions are already eating into valuation. Use these results to maximize your returns while doing something good for the planet.
For CEOs: Voluntary sustainability commitments have gone out of fashion anyhow. Now is a time to act. The more you know about what’s causing your stock price variations, profits, or whatever metric you care about, the better you can maintain and grow your business.
For policymakers: This goes slightly beyond the result of this study—but imagine if you could show that your policy actually causes positive change. I have friends working at the OECD who don’t need my help for this; this is their daily bread and butter. But for those governments, NGOs and think tanks that can’t afford a Princeton PhD every day, Wangari might have something for you. (It’s still early days but yes, we’re exploring the public sector more and more.)
This is also a win for causal- and systems thinking. Traditional research can’t tell you if carbon hurts prices because of reputation, regulation, or simple coincidence. But with causal inference, we isolate the true effect. What’s more, we uncovered which other parts of the system that makes a company might influence this effect (or not).
From Non-Result to Breakthrough
Last week’s groundwater analysis failed. This week’s carbon analysis worked. That’s not luck—it’s progress.
Causal modeling isn’t about proving that sustainability (or any other variable, for that matter) is “good” or “bad” for profits. It’s about learning:
Which factors actually move financial markets?
Which ones are noise?
And how do we find these signals systematically?
My cofounders are right in pushing me to look beyond sustainability. Yes, it’s the thing that makes my heart sing. But we’ll be so much stronger once we have the full data platform ready, with big datasets (including, but not limited to, sustainability), causal inference it its very core, and orchestrated by a beautiful suite of agents.
Our agents are actually quite far already, we’re just finetuning them now and automating causal model building (which currently is done by hand by me). Our data pipeline is also a massive progress from what it was; it still has a bit to go but we’re getting there.
An Unashamed Sales Placement
Doing sales still feels weird to me. But boy does it get easier when you have something that you’re proud to share!
Anyway, we’re opening up a small number of pilot collaborations starting mid-to-late August. (Basically I’ll be taking the next two weeks off, and after that I’ll be refreshed and ready to rumble with new clients.)
Here’s what’s in it for you:
First month free; scoped projects thereafter (~€30k over 3 months for large financial institutions and enterprise clients, negotiable for smaller institutions).
Work with us to test causal hypotheses on your own portfolio or operations.
Test our platform as causal modeling gets more sophisticated (AI! Neural networks!) and more and more automated with AI agents—be part of this journey and get to shape this product to your tastes!
We believe in making the invisible visible. In uncovering the causal underpinnings that give rise to data and, well, the real world. So that, by understanding it better, we’ll all be able to navigate it better and use our newfound clarity to create as much goodness as we can for ourselves and the entire world.
Today, we’ve shown that carbon emissions causally depress stock prices. Tomorrow we can show (or refute) whichever causal hypothesis keeps you up at night.
📬 Just reply to this post or reach out directly if you’d like to be part of the early cohort.
Ari, brilliant work proving carbon emissions causally depress ArcelorMittal's stock price! Your -0.13 cents per megaton finding exemplifies the kind of data-driven ESG approach our field needs. This aligns perfectly with my own views regarding ESG's evolution from compliance-driven "measurement theater" to strategic value creation. Your causal inference cuts through the usual correlation noise, providing the empirical foundation that executives need. As ESG transforms from political flashpoint (especially here in the U.S.) to tangible operational infrastructure, your methodology demonstrates how sophisticated analytics can drive voluntary sustainability action. When one can prove how emissions reductions cause stock price improvements, you've established the business case. This is ESG functioning effectively as a strategic value lever—exactly what I've been advocating. Outstanding contribution to evidence-based sustainability. Thank you!