



Spain won the 2026 World Cup. Congratulations to Spain. And, I suppose, congratulations to me, because several of the eleven models I built to predict the tournament crowned Spain before a single ball had been kicked.
That sounds like a resounding success, but this is not a victory lap. I promised to be critical of my own models, and the truth is that picking the winner is the least interesting fact of all. In the enterprise world—just as in sports forecasting—calling an outcome correctly does not mean your system is actually working.
The consensus of my eleven models gave Spain a 20% chance of winning, followed by France and Argentina at 14%, and then the Netherlands and England. Four of those top five reached the semifinals. It looks like a clean sweep. I could call it a good night, pack up, and sell the algorithm.
But I would be wrong to do so. Because being right is not the same as being calibrated.
The Illusion of Accuracy
A model that gave Spain a 20% chance and a model that gave Spain a 95% chance both “called it,” because both had Spain as the maximum percentage. But in the 20% case, you are not actually stating with high confidence that Spain will win.
It is like flipping a biased coin once, seeing it come up heads, and deciding you understand the bias. You have learned something, but not much. This nuance gets skipped in almost every forecast retrospective I read. The final outcome is a terrible grading instrument. The proper way to evaluate a model is to apply a rigorous scoring rule to every single match prediction made before the tournament began.
Being entirely agnostic about the final champion, I ran all 104 matches through all 11 models and scored them using three metrics: the Brier score, Log Loss, and the Ranked Probability Score (RPS).
The Brier score measures the mean squared error of a probability forecast; lower is better. A naive model that simply guesses 33% for every outcome (win, lose, draw) scores a 0.667. Log Loss severely punishes confident wrongness—it is the metric that catches a model assigning a 3% probability to an event that actually happens. Finally, RPS respects that a draw is an intermediate state between a win and a loss, rewarding models that understand the structure of the game.
The Boring Models Dominated
When the dust settled, the results were definitive. Elo performed best. Poisson was second. The absolute worst model of the eleven was XGBoost.
My pre-tournament prediction was confirmed: every single rating and goal-based model beat every single machine learning classifier. There was no overlap. It was a clean break between the two families.
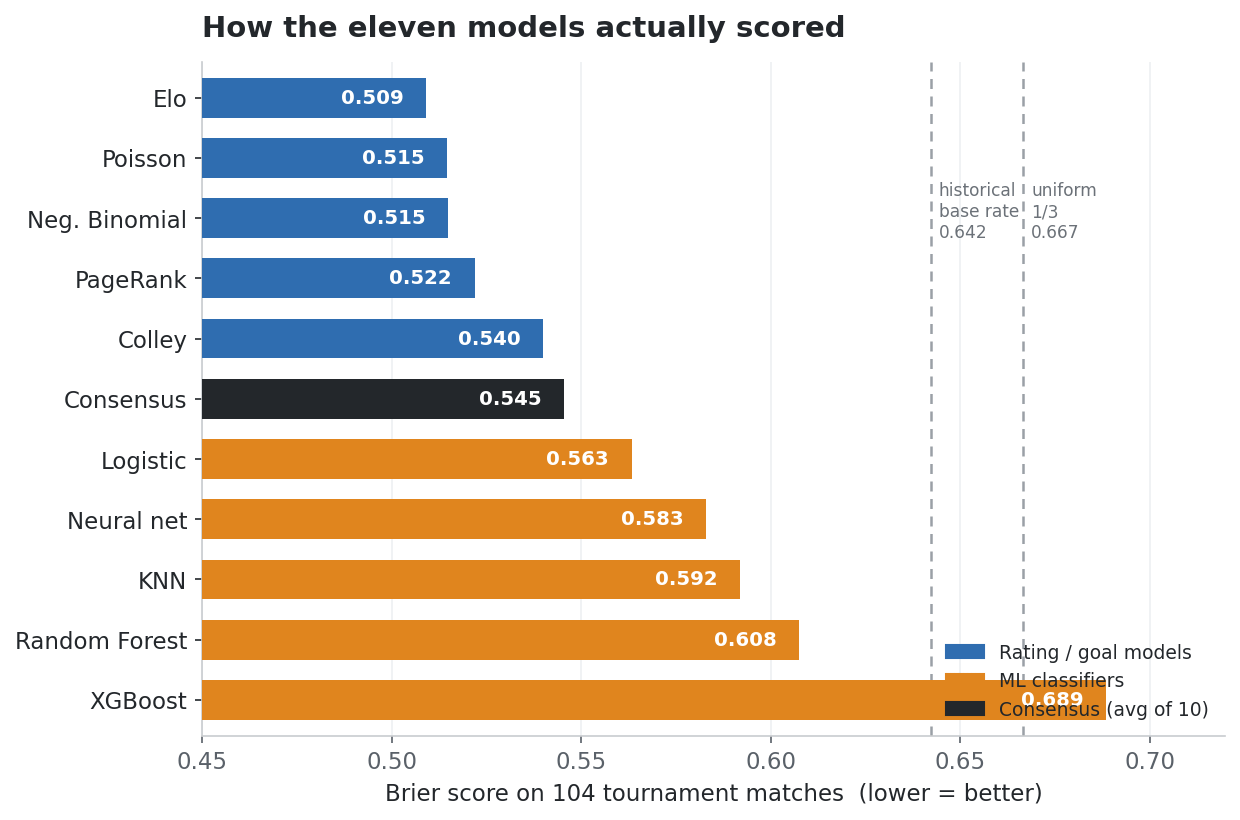
This goes to show that a simpler model with strong inductive bias is often vastly superior to throwing full-power AI at a problem. XGBoost scored a 0.689 on the Brier scale—meaning the most flexible, sophisticated model in the suite was literally worse than blindly guessing 33% (win / draw / loss) for every match. The most complex model was worse than not modeling at all.
There is one caveat: on RPS, XGBoost did beat the baselines. Because RPS respects the ordering of outcomes, XGBoost’s draw-heavy predictions were structurally sensible, even if the raw probabilities were garbage.
Interestingly, Random Forest achieved the best cross-validation accuracy during training, yet it finished ninth out of eleven on the Brier score. Accuracy and calibration are entirely different axes. As AI researchers Sayash Kapoor and Arvind Narayanan have pointed out regarding autonomous agents, a system can achieve high accuracy while remaining dangerously uncalibrated.
The Failure of the Ensemble
Before the tournament, I predicted that the consensus (the average of all eleven models) would beat most of its individual members.
I was wrong. The consensus came in sixth out of eleven. It lost to all five of the simpler rating and goal models. That is a failure.
Averaging only cancels out errors when the member models are comparably good and their errors are uncorrelated. But half of my modeling suite was systematically worse because the machine learning models were too complicated for the sparse data. By averaging them in, the consensus actually imported their errors. Ensembling as a reflex cost me dearly against simply using Elo—a system invented for chess in the 1960s.
The Champion is a Worthless Statistic
Colley, a matrix-based rating system, picked the Netherlands to win the tournament. The Netherlands went out in the Round of 32 on penalties. Yet, Colley finished fifth overall on the Brier score, out-forecasting six other models, including the two that nearly picked the correct champion.
Random Forest and XGBoost picked Argentina—the eventual runner-up. Yet they finished ninth and tenth in overall forecasting quality.
The two models that came closest to naming the champion were the worst forecasters. The model with the most embarrassing headline miss was solidly above average. It is not about who lifts the trophy; it is about the 104 matches in between. One tournament outcome does not rank forecasters.
Where the Calibration Broke
Overall, the consensus model was slightly underconfident. The average predicted probability for the favored team was 53.1%, but favorites actually won 58.7% of the time.
However, this miscalibration was not spread evenly. It was heavily concentrated in a single band: the 50% to 60% bucket. In matches where the model gave the favorite a 54% chance, reality delivered a 73% win rate.
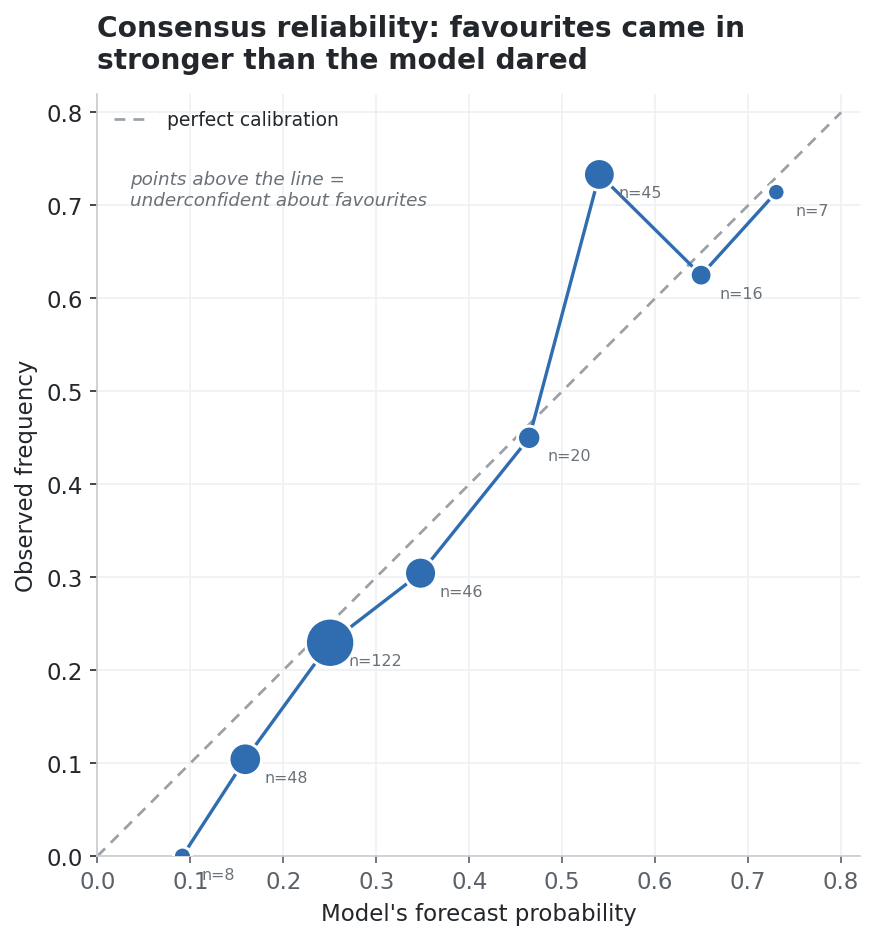
Above 60% and between 40-50%, the model sat perfectly on the diagonal of perfect calibration. Below 40%, it was mildly overconfident about underdogs. The draw curve—which I fitted separately—was a triumph. The mean predicted draw rate was 25.7%, and the actual tournament draw rate was 26.0%. It does not get closer than that.
The headline on my chart claims that favorites came in stronger than the model dared to predict. That is true in aggregate, but the honest version is narrower: one specific probability band was badly off, while the rest performed admirably.
The Missing Data Problem
There were two matches that the models called worse than any others, and both involved Cape Verde.
In the group stage, Spain played Cape Verde to a 0-0 draw. The model had given Spain a 76% chance of winning, resulting in a massive Log Loss of 1.838. Later, Argentina played Cape Verde in the Round of 32. It was level after 120 minutes. The model had given Argentina a 72.8% chance, resulting in a Log Loss of 1.761.
Cape Verde were tournament debutants. They had zero match history in our 358-game training set. Because the models had no data, they fell back to the prior distribution.
This was not a failure of probability tuning; it was a coverage gap. All eleven models shared this blind spot. While ensembling reduces method variance, it cannot manufacture information about missing data points. If the data does not exist, averaging eleven ignorant models just gives you a highly confident ignorant model.
(As an aside: the model was not worse in the knockout stages. The group stage Brier score was 0.547, and the knockout stage was 0.501. This directly contradicts the usual sports cliché that “knockouts are a coin flip.”)
The Enterprise Lesson
What do we learn from this? And how does it translate to enterprise AI, business forecasting, or resource allocation?
First, the best performing system in the suite was Elo—a simple, elegant model from the 1960s. Complexity must match data volume. If you have limited data or high irreducible noise, a simple model with strong inductive bias will almost always beat a complex neural network.
Second, do not ensemble by default. If half your models are importing noise, averaging them makes your system worse.
Third, audit your coverage. If your enterprise model is forecasting a new market, a new product, or a new competitor (your business equivalent of Cape Verde), recognize that the model is falling back to a prior. It is guessing.
The common thread for deploying AI in the enterprise is this: write your assumptions down. Commit to the grading rule before the results happen. And when the project is over, publish the grade—especially the parts that make your earlier arguments look worse. That is how you build reliable systems.
Meanwhile, at Wangari
While our core business remains enterprise reporting, we’re sharing our soccer models with the world!
Out now on Spartera are two models:
Soccer Match Probability Outcomes: Updated daily, tells you the probability of any match outcome in major European leagues.
Soccer Team Form Ratings: Tells you how well your teams in European leagues are doing right now. Updated daily.
Spartera is a brilliant platform that allows buyers and sellers of data to come together and share their pots of gold (ahem, insight).
Reads of the Week
AI’s Reliability Gap: Nathan Witkin presents rigorous, well-sourced essay arguing that the limited economic impact of AI doesn’t stem from capability gaps but from reliability gaps. That includes inconsistency, brittleness under minor perturbations, and the verification burden that defeats the purpose (ever had to review AI-generated results?). Essential reading for anyone deploying AI in production.
AI Infrastructure Is Moving Up the Stack: A clear-eyed analysis by Lake Dai of how the AI bottleneck in Q2 2026 shifted from hardware to the software control plane: orchestration, evaluation, observability, and governance are important now. She argues that better models don’t automatically create reliable products. I fully agree: the hard part of AI is not the model; it is the surrounding system.
The AI Superforecasters Are Here: Scott Alexander notes that AIs are now approaching human superforecaster performance on prediction markets. What does it mean when AI can beat humans at calibrated probabilistic reasoning? Ultimately, it boils down to this: the big question is when to trust a model’s probabilities, and when to defer to your own judgement.