

Diversity Is Stability: Women Cause Share Prices to Go Up
In a male-dominated company, our analysis finds that women bring in cash


I spent ten days on a Vipassana meditation retreat recently, watching my breath and my mind do their awkward duet. One detail from the meditation hall refuses to leave me: there were almost twice as many women as men sitting in silence.
No medals were handed out—there aren’t any in a place where even smiles feel loud—but it landed as a quiet statistic about effort. Inner work is also work. Some people show up for it more consistently.
Back at my desk, still a little slow from all that quiet, I opened the ArcelorMittal dataset—the steel company with blast furnaces big enough to bend horizons—and asked a question I both wanted and feared to test:
If we add more women to management, does the stock price go up?
Wanting an outcome is not proof of anything. So I built a small, honest causal model and let the data talk.
Why harmony shows up in markets
Markets don’t reward slogans. They reward working systems: fewer errors, smoother execution, cleaner communication. Call it stability. Teams that blend different ways of seeing—lived experience, training, temperament—avoid brittle decisions. In a public market, stability is priced. You can see it in risk premia, in volatility, in the patience of capital.
Meditation smooths mental noise. Diversity smooths organizational noise. If the second sentence is true, the first should leak into the ticker.
The hypothesis in two strands
There might be two reasons why women in management might produce better share prices:
A direct governance effect:
Mixed and diverse teams naturally take better decisions. That shows up as teadier execution. In valuation terms, you lift the cash‐flow numerator (and sometimes the sustainable growth), so price rises even if risk doesn’t change.A risk- or mediation effect:
More women in management might mean lower volatility, i.e., less erratic share price movements. Markets price that stability: lower perceived downside risk trims the required return, easing the discount rate in the denominator in a valuation model—so price rises even if cash flows don’t move much.
It’s worth noting that this isn’t a universal law of nature. At this stage, it’s a hypothesis at best. It’s a test inside one firm in one industry across one decade. But if the signal appears in a place as noisy as steel, that’s meaningful.
The lean model (why small beats clever here)
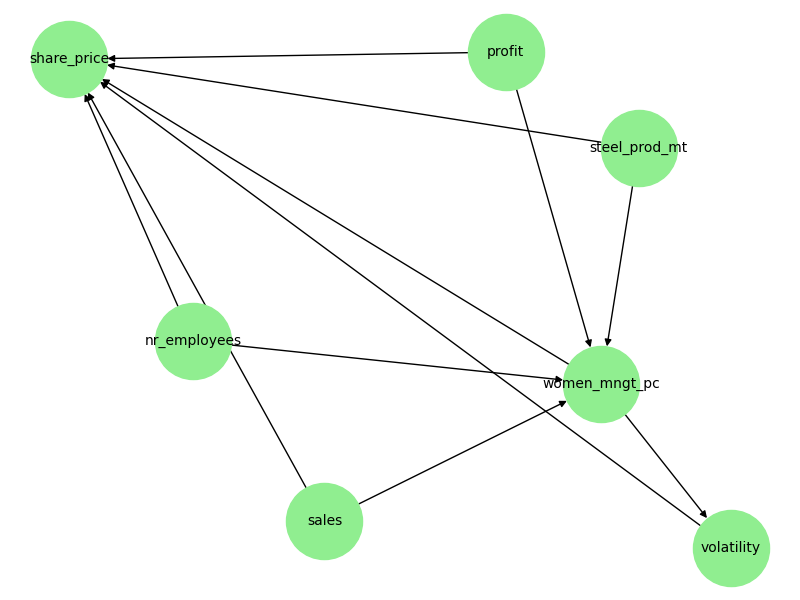
Annual data is scarce oxygen. With eleven observations (2013–2023: the period when “women in management” is consistently reported), I wanted a minimal causal graph—the kind of whiteboard drawing a CFO and COO would agree on in three minutes:
Treatment: the percentage of women across management positions
Outcome: the share price (annual average—deliberately simple)
Confounders: profit, sales, number of employees, and steel production volumes (fundamentals that influence both diversity and price)
Mediator: volatility (the risk channel)
Edges, in words: fundamentals influence both diversity and price; diversity can reduce volatility; volatility affects price; diversity can also affect price directly.
A tiny model is a moral choice as much as a technical one. With this little data, baroque graphs are fashion accessories.
First, hear the music
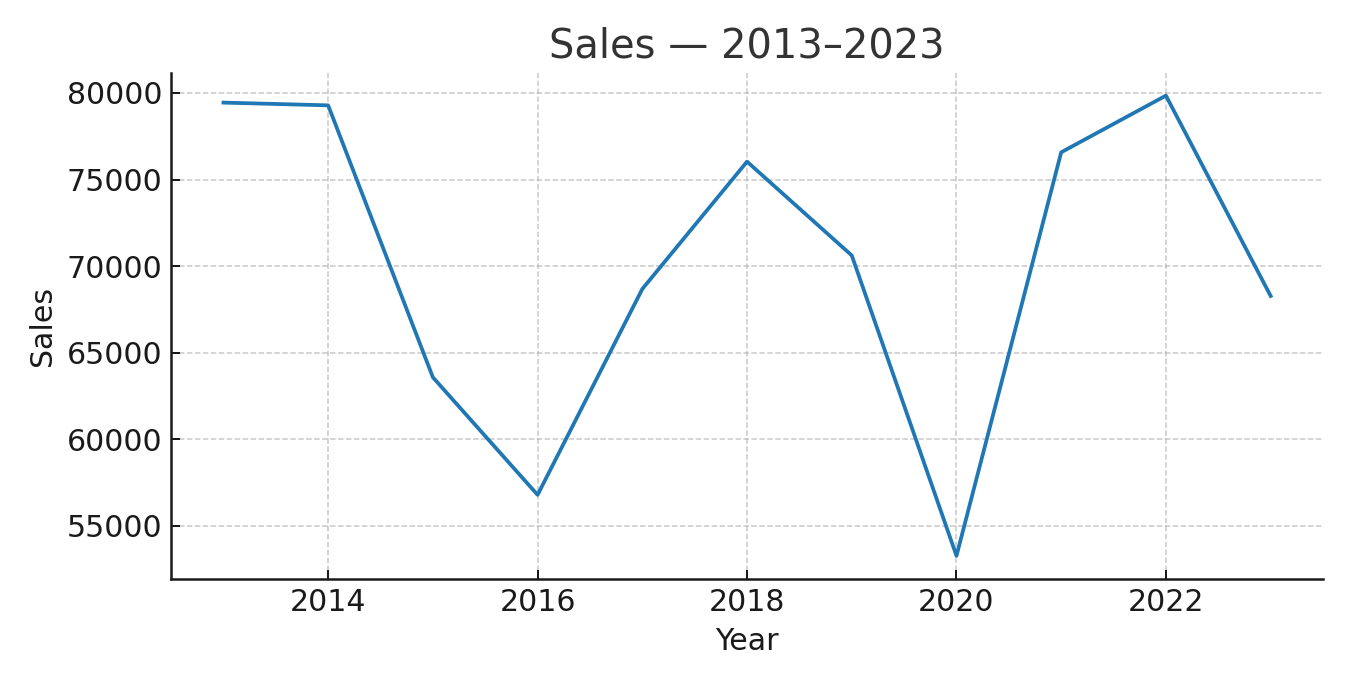
Before analyzing the orchestra, I like to hear a few bars. Here’s how the percentage of women in management evolves (dashed line) and the share price (annual average, solid line):
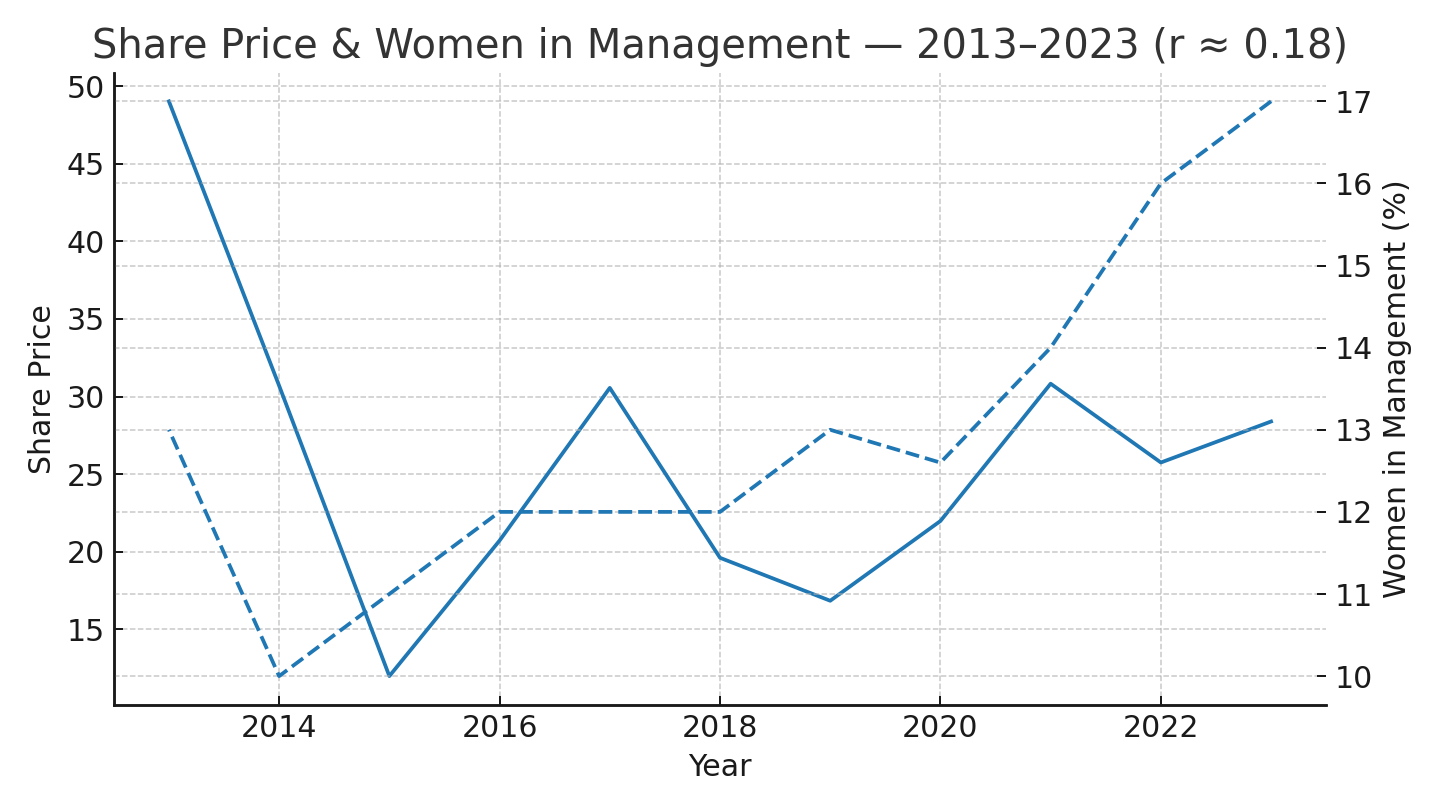
The data starts in 2013. To be fair, I’d gathered it all the way back to 1999—but ArcelorMittal only started reporting on their women percentage in 2013, hence the delay.
Women in management climbs from the low-teens toward the high-teens. The stock price does what stock prices do: wander, drop, rally, sulk, surprise. The raw correlation is ~0.18—small. Good. Correlation isn’t the point; causality is.
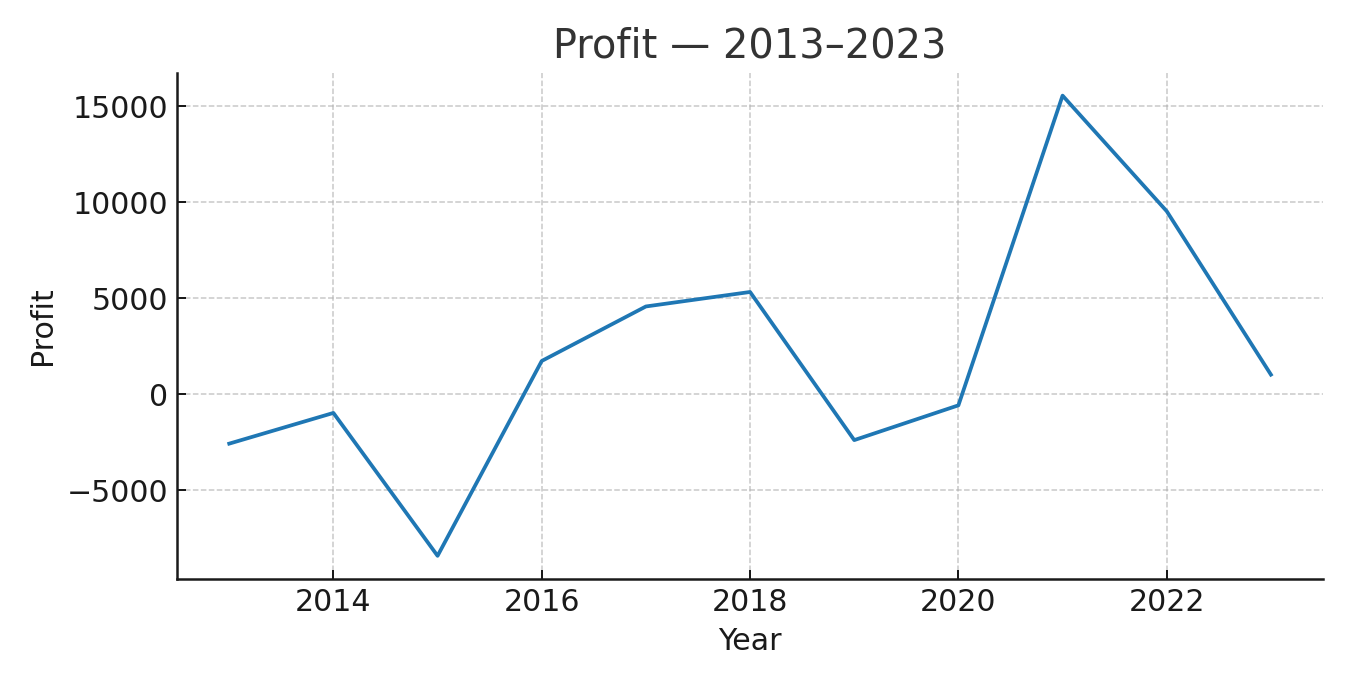
Supporting context—the background instruments the market listens to:
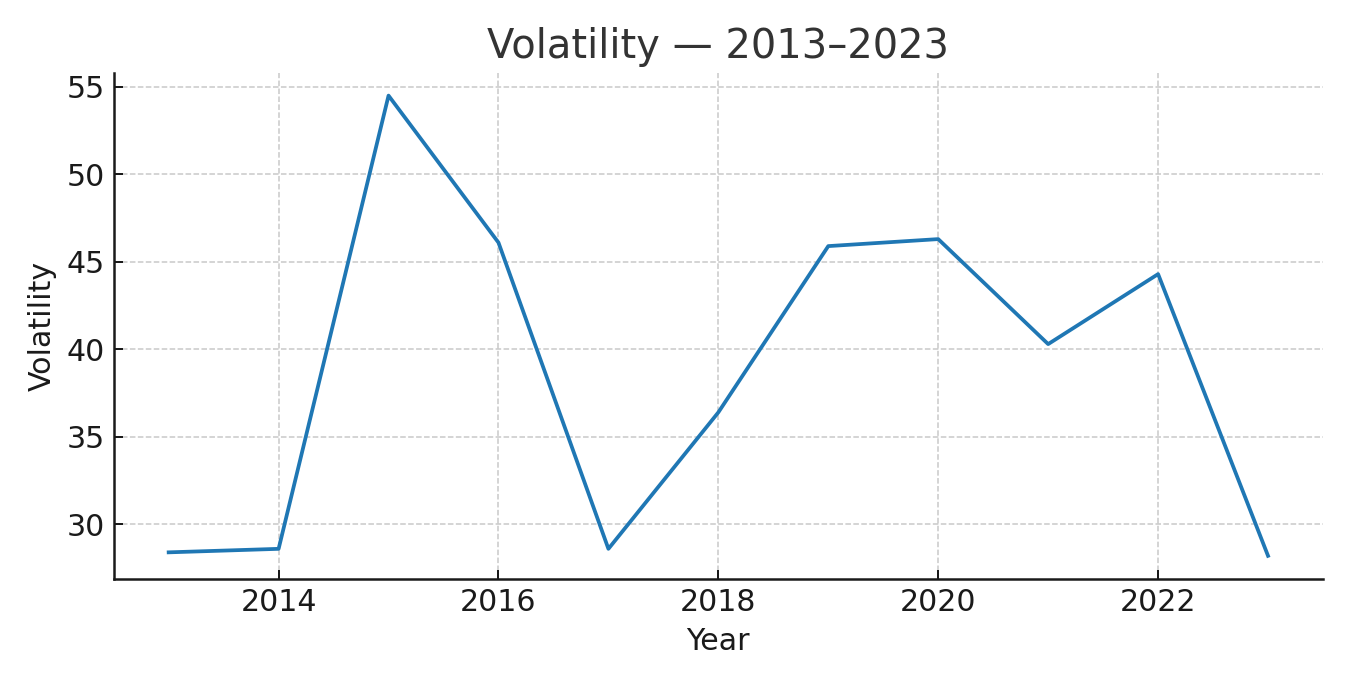
Volatility is the one I keep circling: if diversity truly stabilizes, it should show up here. Markets pay for calm hands.
Estimation (no heroics, just discipline)
We’re performing two regressions on the same outcome (share price) and with the same treatment (percentage of women in management):
Total effect — control for confounders only (profit, sales, number of employees, steel production).
Direct effect — control for confounders plus volatility to block the risk channel.
DoWhy gives a clean identification wrapper; estimation is plain OLS. For uncertainty, I use bootstrap confidence intervals—they’re honest with small samples.
What the data said (and how big it is)
Here are the results of our causal treatment, with error bars:
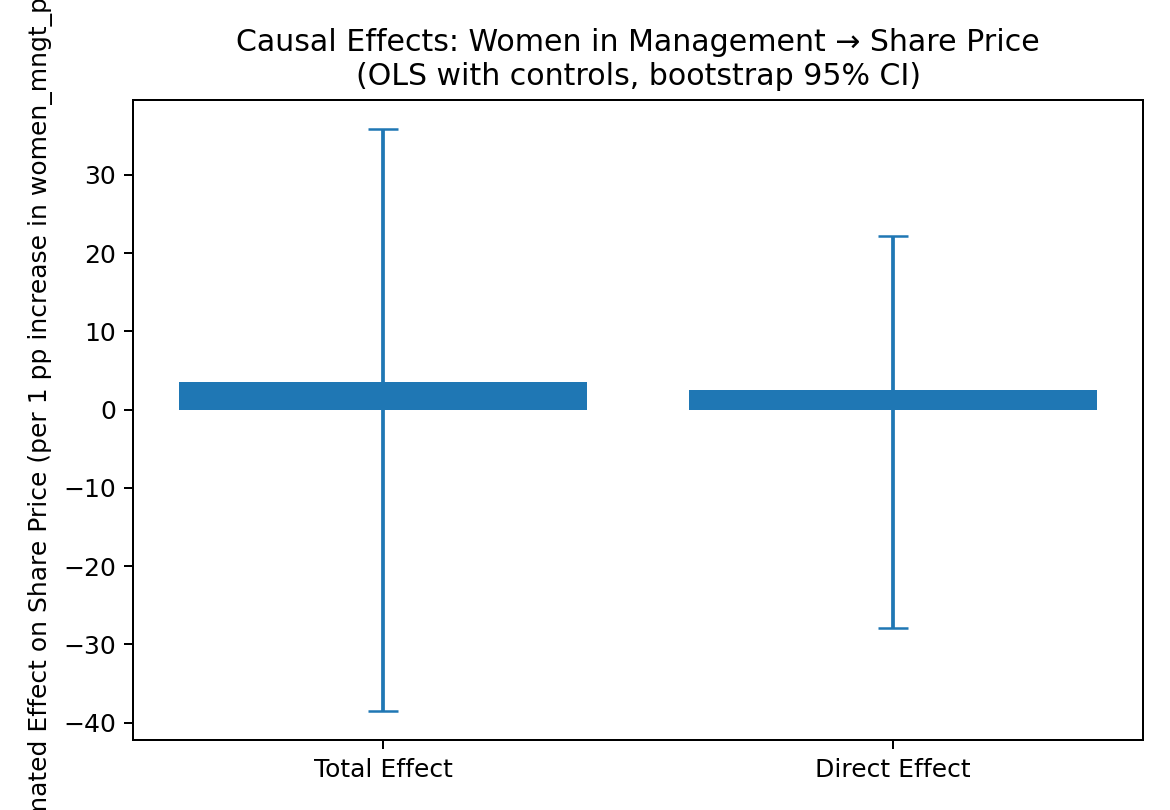
These are the results:
Total effect: +3.48 share-price units per +1 percentage point women in management (bootstrap 95% CI: −38.54, +35.87; n=11)
Direct effect (controlling for volatility): +2.47 (bootstrap 95% CI: −27.88, +22.15; n=11)
Let’s talk magnitude, because this is the headline:
A +1 percentage point increase in women in management corresponds to roughly a +€2.5 to +€3.5 rise in the share price (point estimates).
If the stock trades, say, around €25–€30, then a +10 percentage point change in women in management (e.g., 12% → 22%) implies a +€25–€35 move—a price change on the order of the current level.
Even if you prefer the more conservative direct estimate (~€2.5 per point), a +10pp shift suggests ~€25 higher—roughly a doubling of the stock price! Consider that: You might be able to double your stock price by hiring a few dozen female employees.
That’s enormous. And it’s precisely why we have to carry the error bars with humility: point estimates trumpet; intervals keep us honest. With eleven annual observations, wide CIs are expected. The sign is consistent; the narrative is coherent. Precision comes next (see below).
There’s also a story in the 1-point gap between total and direct: part of the benefit seems to run through volatility. Diversity → stability → value. The direct effect—governance, decision quality, informational richness—remains after we block the risk path.
The only code you actually need: Bootstrap Confidence Intervals
You’ve seen me publish full causal pipelines and refutations before; here I’m including only the bit about confidence intervals (CIs), because uncertainty is the adult in the room. This function resamples the firm-years with replacement, re-fits the OLS each time, and uses the 2.5th/97.5th percentiles of the treatment coefficient as bounds.
import numpy as np, statsmodels.api as sm

def bootstrap_ci(df, y_col, t_col, controls, n_boot=1000, seed=42):
    rng = np.random.default_rng(seed)
    coefs = []
    Xcols = [t_col] + controls
    for _ in range(n_boot):
        sample = df.sample(len(df), replace=True, random_state=rng)
        X = sm.add_constant(sample[Xcols], has_constant='add')
        y = sample[y_col]
        try:
            coefs.append(sm.OLS(y, X).fit().params[t_col])
        except Exception:
            pass
    coefs = np.array(coefs)
    lower, upper = np.percentile(coefs, [2.5, 97.5])
    return np.mean(coefs), (lower, upper)
Other ways to get CIs include the following:
Analytical (regression) CI: you’d run this with something like
model.conf_int().loc['women_mngt_pc']—fast and familiar.HAC/Newey–West errors: swap in a robust covariance for serially-correlated annuals.
Block bootstrap: if you were on higher-frequency data, resample in blocks to respect time dependence.
“But correlation?” (It can’t answer this.)
In this sample the raw correlation is ~0.18—small and, on its own, not very meaningful. Correlation answers “how do these two variables drift together?” Causality answers “what happens to the outcome if I intervene on the treatment?”
Intervention is the heart of this. If ArcelorMittal chooses to lift the share of women in management by 5 percentage points, what should long-only investors expect in price, all else equal? Correlation can’t answer that. A properly identified treatment effect can.
And if part of the channel is volatility, correlation becomes even more misleading: you’re peeking through a moving kaleidoscope. The regression with and without volatility is a disciplined way to untangle it.
What the market might be pricing
A possible reconciliation that fits both estimates and time series:
Teams with more women in management make fewer catastrophic errors (the ones that become reputational events, litigation, regulatory pain, or “we’ll fix it in Q4” calls).
They course-correct earlier—less ego, more information actually moving.
The earnings distribution tightens; the tails shrink.
The volatility investors see drops a notch. Liquidity providers demand a smaller premium; patient capital can hold.
Over time, this re-rates the stock.
It’s not the only channel, but if it’s even partly true, it explains why the total effect exceeds the direct effect: some of the magic flows through risk.
Honesty about uncertainty (and how to tighten the bands)
Why are the uncertainty bands so wide?
Small-n reality: eleven annual observations.
Price levels instead of returns.
Single-firm lens in a macro world.
What I’d do to turn this into publishable-grade or boardroom-grade precision:
Build a panel. Add comparable steel/mining/industrial firms. Estimate with firm fixed effects (absorb time-invariant differences) and year fixed effects (absorb global shocks). Partial pooling via hierarchical Bayes is powerful when firms differ. (You’ll see plenty of this if/when you become a paying client of my firm.)
Model returns/log-price and use HAC/Newey–West errors to tame serial correlation.
Add lags. Use
women_{t−1}(or multi-year lags) to predict price att. It’s not a panacea for reverse causality, but it guards against “price up → everyone hires” stories. (We look at this a lot.)Sensitivity & refutations. Negative-control outcomes, Oster’s δ, Rosenbaum bounds, E-values—quantify how strong a hidden confounder must be to erase the effect.
Natural experiments / IV where feasible. Quota expansions, governance-code changes, exchange listings, or sudden pipeline shocks to leadership composition can instrument for women in management and sharpen identification.
A quick word about synthetic data, because I’m sure I’m not the only one having pondered that possibility: it’s excellent for simulation, power analysis, and method validation (e.g., “how many firm-years do we need for a ±€5 CI?”). However, it’s not a substitute for real observations when making claims; it just helps you plan how to gather the ones you need (unless your data follows a very predictable pattern, which ours often doesn’t).
So… what?
For investors: If you like stability premia, this is your language. There appears to be a priced benefit to more women in management. Even if you’re agnostic on the direct governance channel, the volatility channel alone is an investable thesis: stability compounds.
For executives: Inner work is also work. Teams that do it—through real diversity, not quarterly box-ticking—behave differently under pressure. Investors notice (not for every company, but for many). If you’re budgeting for programs that feel “soft,” this is your reminder that the hard edge often shows up in risk.
For policymakers: You don’t have to legislate belief. Show the causal path; behavior moves. When boards see a valuation premium attached to safer decision-making, they build it.
For researchers and quants: Correlations got us to this frontier; causality gets us past it. The reward, besides better models, is interpretability executives can use and regulators can debate without rolling their eyes.
A return to the meditation hall
The image stays with me: rows of people sitting still, most of them women, doing work nobody sees. Ten quiet days later, a noisy market answered with a similar shape: do the work, reduce the noise, and value appears.
The mechanism is different—org charts and order books instead of breath and attention—but the pattern rhymes.
I can’t promise every firm will show this effect. I can promise we’ll test it honestly, reveal it when it’s there, and refute it when it isn’t. That’s the work I want Wangari to be hired for: making the invisible visible, then doing something useful with it.
Pilot collaborations (a few spots left!)
We’re opening a small number of pilot collaborations starting very soon. A couple of spots are still available. What you get:
First month free, then a scoped engagement (~€30k over 3 months for large financial institutions and enterprise clients; negotiable for smaller institutions).
Hands-on causal studies on your portfolio or operations: clear DAGs, treatment-effect estimates, and executive-ready visuals.
Early access to our agent-orchestrated platform as we automate more of the data/causality pipeline.
The chance to co-shape the product—your use cases directly steer features.
If you want in—or want to try to break our methods—reply to this post and we’ll set it up.